
In this article I will try to compare BTC, ETH and XCH value creation in comparison to their respective electricity consumption.
The idea is simple, calculate and compare how much value per watt (€/Wat) these 3 networks are creating for every Watt of electrical energy they are consuming, with the accent on Chia Network and its XCH coin in the hope that this research will show how green Chia Network really is.
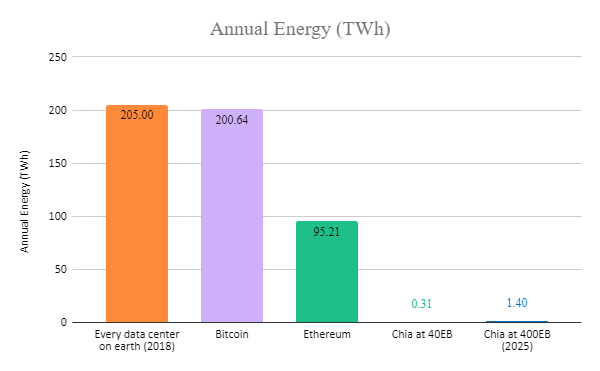
Figure 1 shows annual energy consumption of BTC, ETH and XCH respectively (source: https://chiapower.org/), so we will use it as a starting point to calculate the value per watt of electrical energy every network is creating.
-
BTC – Bitcoin
For Bitcoin Figure 1 shows average annual consumption of 200.64 TWh.
On average, Bitcoin is mined 144 block per day (source: https://stats.buybitcoinworldwide.com/blocks-daily/,
https://www.the-sun.com/tech/3229334/how-many-bitcoins-left-mine/)
365 days in one year makes total of 144*365=52.560 BTC blocks.
1 block contains 6,25 BTC (source: https://www.buybitcoinworldwide.com/how-many-bitcoins-are-there/)
6,25*52.560=328.500 BTC per Annum
At this moment in time 1BTC=45.000€ (source: https://coinmarketcap.com/currencies/bitcoin/)
45.000€*328.000=14.782.500.000€.
So current BTC network value production is 14.782.500.000€ per Annum.
If we return to figure 1 where it shows 200,64TWh = 206.640.000.000.000Wh, dividing this consumption with the value production we get this result
14.782.500.000€ / 206.640.000.000.000Wh = 0,000072 €/Wh
This means for every 0,0000715 euro mined in value 1 watt of electricity is being consumed.
-
ETH – Ethereum
For Ethereum, Figure 1 shows average annual consumption of 95,.21 TWh.
On average, Ethereum is mined 18.000.000 ETH per Annum)
(source: https://www.statista.com/statistics/1224536/mining-difficulty-ethereum/, https://www.google.com/search?sxsrf=AOaemvIFSMaVczm9bA8v0koEf4gNxflbXg:1640385889062&q=How+many+Ethereum+are+mined+each+year, )
ETH is quite popular so sources on this are very abundant.
At this moment in time 1ETH=3.650€ (source: https://coinmarketcap.com/currencies/ethereum/historical-data/)
3.650*18.000.000=65.700.000.000€.
So current ETH network value production is 65.700.000.000 € per Annum.
If we return to figure 1 where it shows 95,21TWh=91.210.000.000.000 Wh, dividing this consumption with the value production we get this result
65.700.000.000 € / 91.210.000.000.000 Wh = 0,00072 € / Wh
This means for every 0,00072 euro mined in value 1 watt of electricity is being consumed!
-
XCH – Chia Network
For Chia, Figure 1 shows average annual consumption of 0,31 TWh for 40EiB Chia Network size.
If we rely on its data, since the current Network size is around 30EiB we can scale the consumption using a proportion 0,31:40=x:30 to match the current network size. By doing this we get a consumption of 0,23 TWh for the current network size of 30EiB.
On average, Chia is farmed 4.608 blocks per day (source: https://www.google.com/search?q=how+many+chia+blocks+are+farmed+per+day )
365 days in one year makes total of 365*4.608=1.681.920 XCH blocks.
1 block contains 2XCH (source: https://www.chiaexplorer.com/chia-coins)
2*1.681.920=3.363.840 XCH per Annum.
At this moment in time 1XCH=89€ (source: https://coinmarketcap.com/currencies/chia-network/)
89*3.363.840=299.381.760 €.
So current Chia Network value production is 299.381.760 € per Annum.
If we apply the same math and divide this value production with its electricity consumption of 0,23TWh = 230.000.000.000 Wh,
299.381.760 € / 230.000.000.000 Wh = 0,0013 €/Wh
This means for every 0,0013 euro mined in value 1 watt of electricity is being consumed!
Figure 2. Showing value production in Euro per Watt.
In this calculation, I did not calculate any parameter that has to do with ROI, because the ROI was not the topic of this article and at the moment I am not interested in ROI calculations, altho the ROI is in correlation with the VP (value production) parameter due to the corresponding prices of components.
Figure 2 is showing obvious higher efficiency in value production for Chia Network, compared to the Bitcoin and Ethereum. What is down side to this results is the relative difference wich is only x2.
By my opinion for Chia Network to be truly Green, the difference of VP from Ethereum needs to be at least x10, and ideally x100. An increase in token value will enable that.
Article by:
Radovan Georgijevic,
MSc science, PhD student
University of Belgrade,
Faculty of physical chemistry.
I am currently working to create an app (Web, Android and IOS) that will measure this “Value Production” parameter in real time for all the different Cryptocurrencies, providing data and showing that Chia Network is still the best Eco friendly Crypto.
If you want to support my future work, research and development contact me at radovan.georgijevic[@]yahoo.com, any support will be appreciated.
You are free to use the content of this article, and its statements as long as you refer to it via URL, otherwise I will consider that you are infringing my copyright!


will gan
February 20, 2022 at 11:06 amThe most important financial logic is scarcity. If the hard disk random number can be used by an infinite number of forked coins, Chia coins will lose their scarcity
[…] my previous article “Chia network efficiency comparison to BTC and ETH” I have calculated CGE (XCH) = 0,0013 […]
[…] Chia network efficiency comparison to BTC and ETH […]